Campaign Reports
Score CRM provides comprehensive, real-time reporting for every campaign, optimized for instant data access even with millions of recipients.
Accessing Reports
Navigate to Campaigns → [Your Campaign] → Report to view the full report.
Report Sections
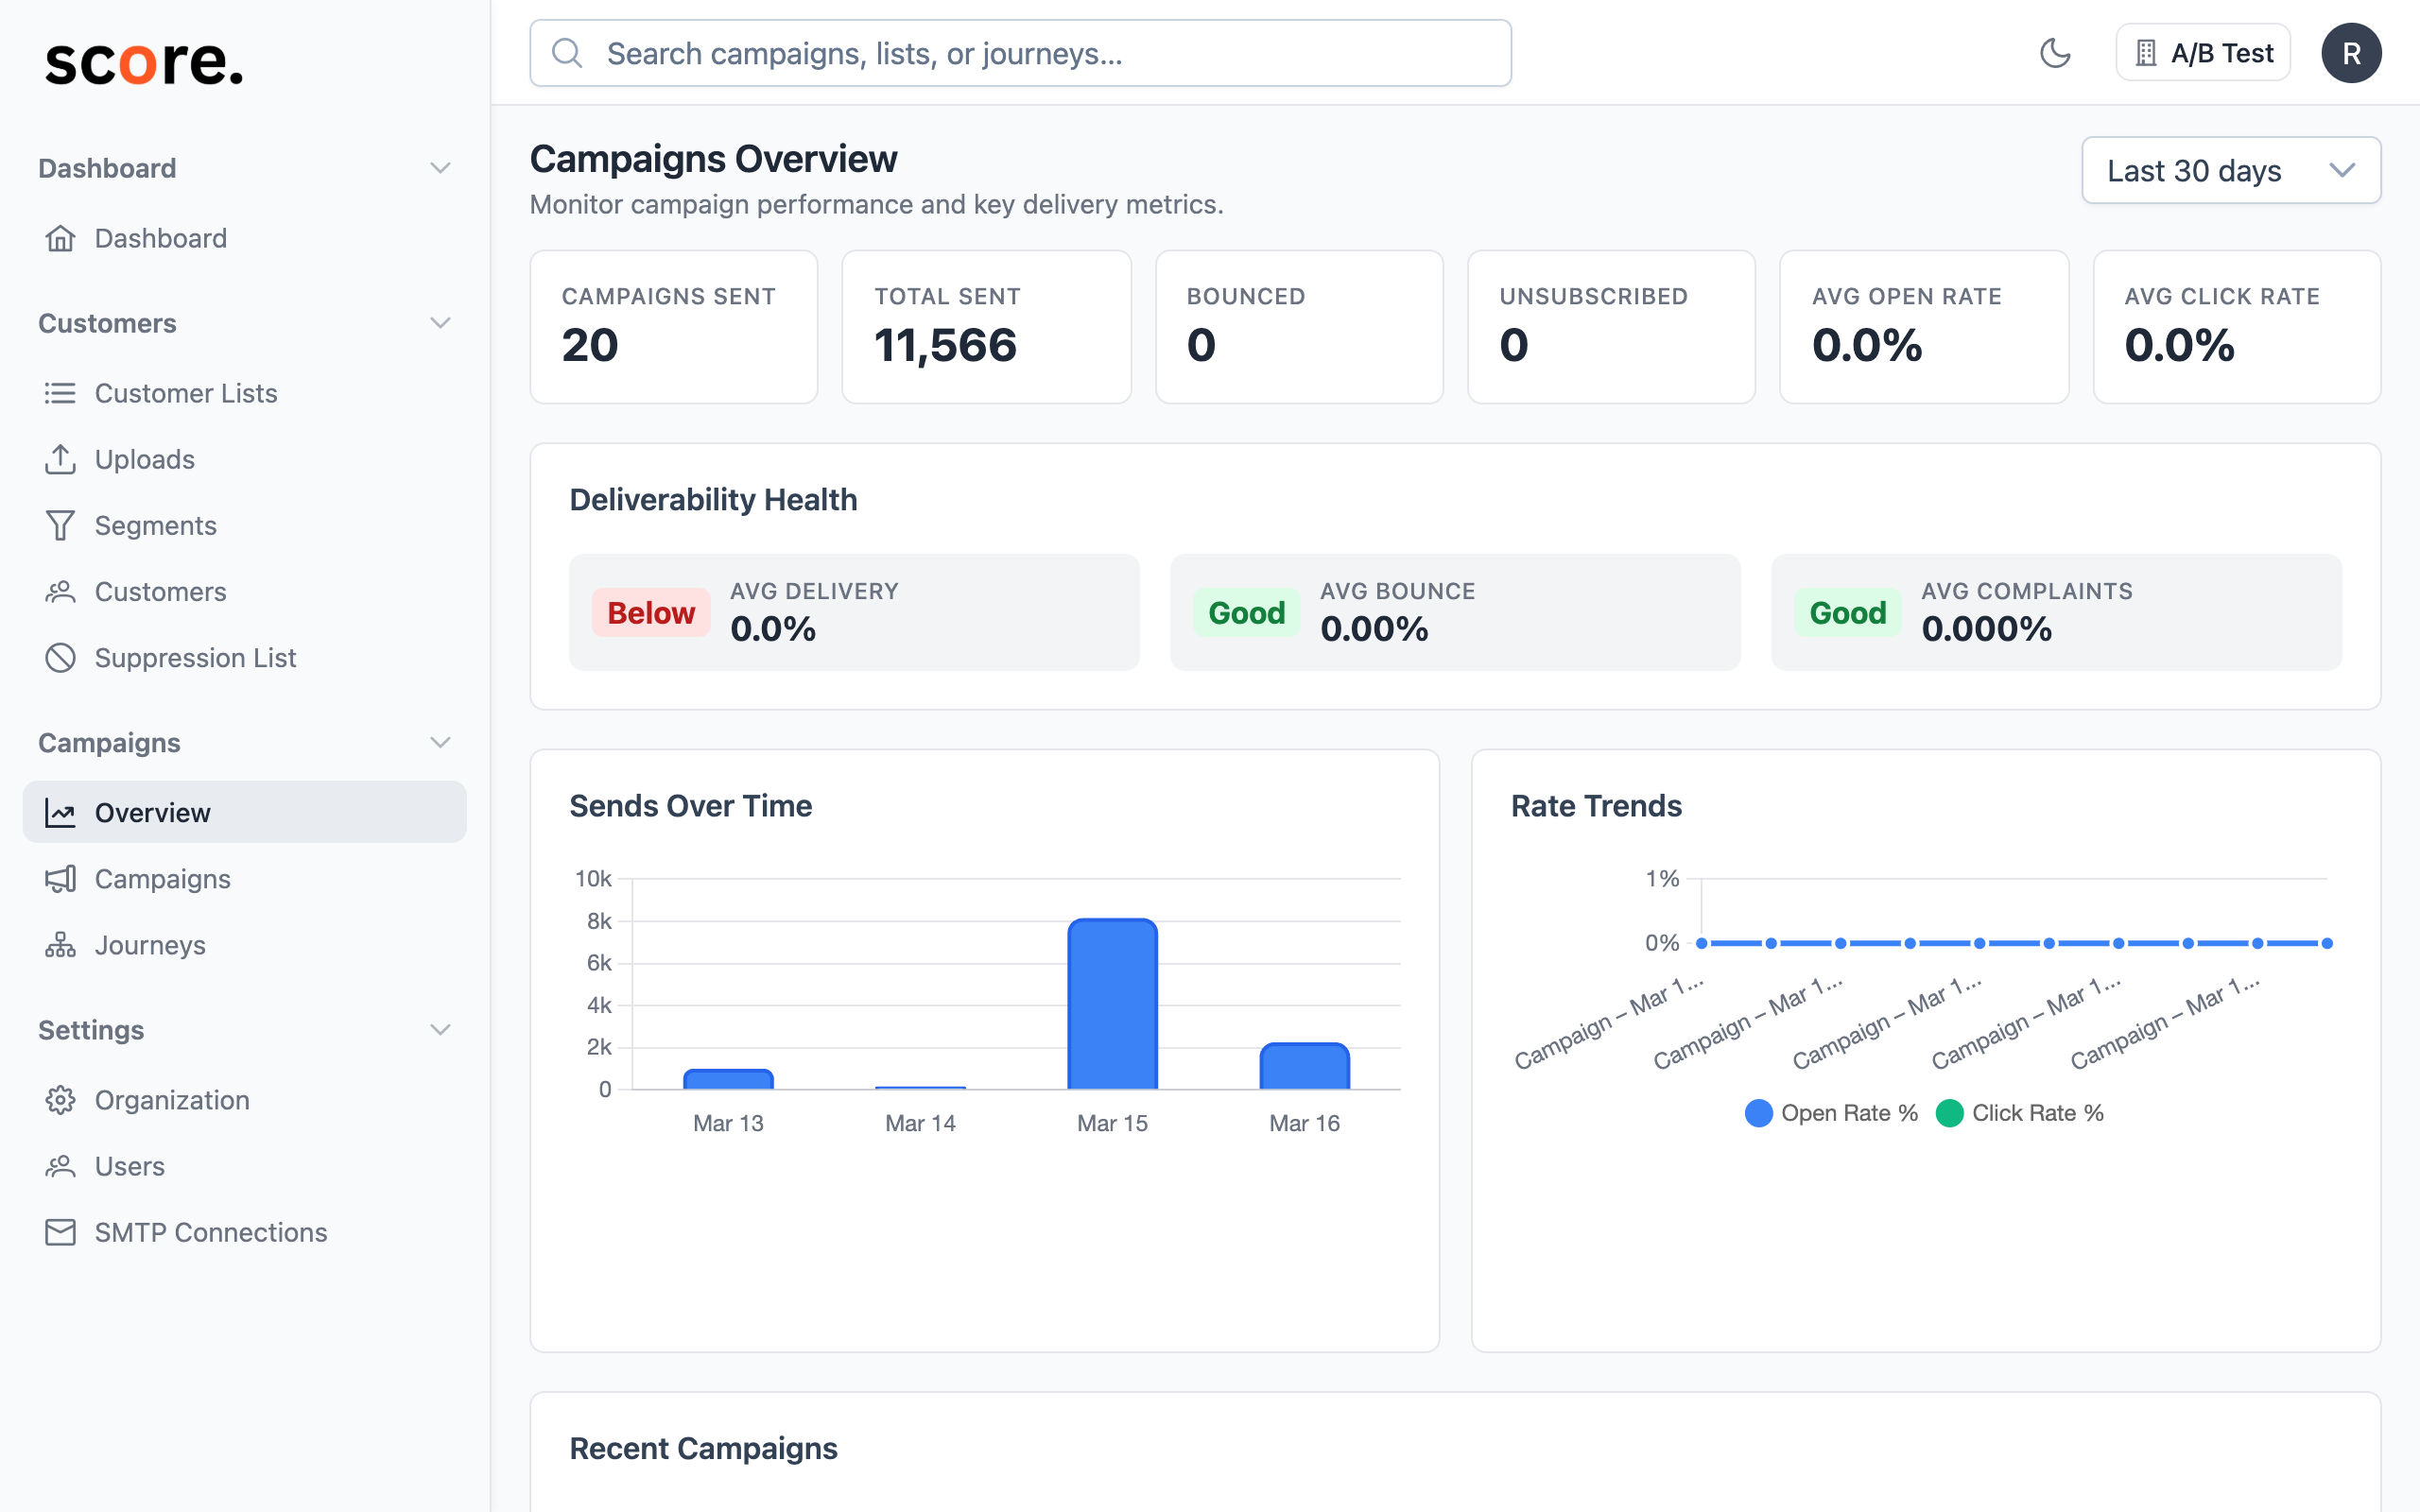
Summary Metrics
The top-level summary shows key performance indicators:
| Metric | Description | Calculation |
|---|---|---|
| Total Sent | Emails dispatched | Count of sent events |
| Delivered | Successfully delivered | Count of delivered events |
| Opened | Unique opens | Count of unique opened events |
| Clicked | Unique clicks | Count of unique clicked events |
| Bounced | Failed deliveries | Count of bounced events |
| Complained | Spam reports | Count of complained events |
| Unsubscribed | Opt-outs | Count of unsubscribed events |
Derived rates:
- Open Rate = Opened / Sent × 100%
- Click Rate = Clicked / Sent × 100%
- Click-to-Open Rate = Clicked / Opened × 100%
- Bounce Rate = Bounced / Sent × 100%
- Complaint Rate = Complained / Sent × 100%
Timeline Chart
A time-series visualization showing sends, opens, and clicks over time. Data is bucketed by hour and displayed in your organization's timezone.
This helps you understand:
- When engagement peaks occurred
- How quickly recipients engaged after delivery
- The long-tail engagement pattern
Per-Link Click Tracking
Every link in your email is tracked individually:
| Data Point | Description |
|---|---|
| Link URL | The destination URL |
| Total Clicks | Number of times the link was clicked |
| Unique Clicks | Number of unique recipients who clicked |
| Top Clickers | Recipients who clicked this link the most |
Geographic Breakdown
See where your engagement is coming from:
- Opens by Country: Which countries are opening your emails
- Opens by City: City-level granularity
- Clicks by Country/City: Same breakdown for click engagement
Device & Client Statistics
Understand how recipients read your emails:
- Email Clients: Gmail, Outlook, Apple Mail, Yahoo, etc.
- Devices: Desktop, Mobile, Tablet
- Browsers: Chrome, Safari, Firefox, etc. (for click events)
Recipient Browser
A paginated, filterable table of all recipients showing:
- Email address
- Delivery status
- Open/click status
- Timestamp of each event
You can filter by status (delivered, opened, clicked, bounced, etc.) to drill into specific segments.
Event Activity Log
A chronological feed of all events for the campaign, showing exactly what happened and when.
A/B Test Reports
If the campaign uses A/B testing, additional report sections are available:
Per-Variant Metrics
Each variant has its own summary metrics, making it easy to compare performance.
Variant Heatmap
A matrix visualization showing performance across all variant combinations. This is especially useful when testing multiple fields (e.g., 3 subjects × 2 content versions = 6 combinations).
Exporting Data
You can export report data as CSV files:
- Recipients Export: Full list of recipients with their engagement data
- Event Log Export: Complete activity timeline
Real-Time Updates
Campaign stats are updated in real-time as events are received from your ESP webhooks. There's no delay — as soon as a recipient opens or clicks, it appears in the report.
Stats are pre-aggregated for each campaign, so even campaigns with millions of recipients load their summary stats in milliseconds.